
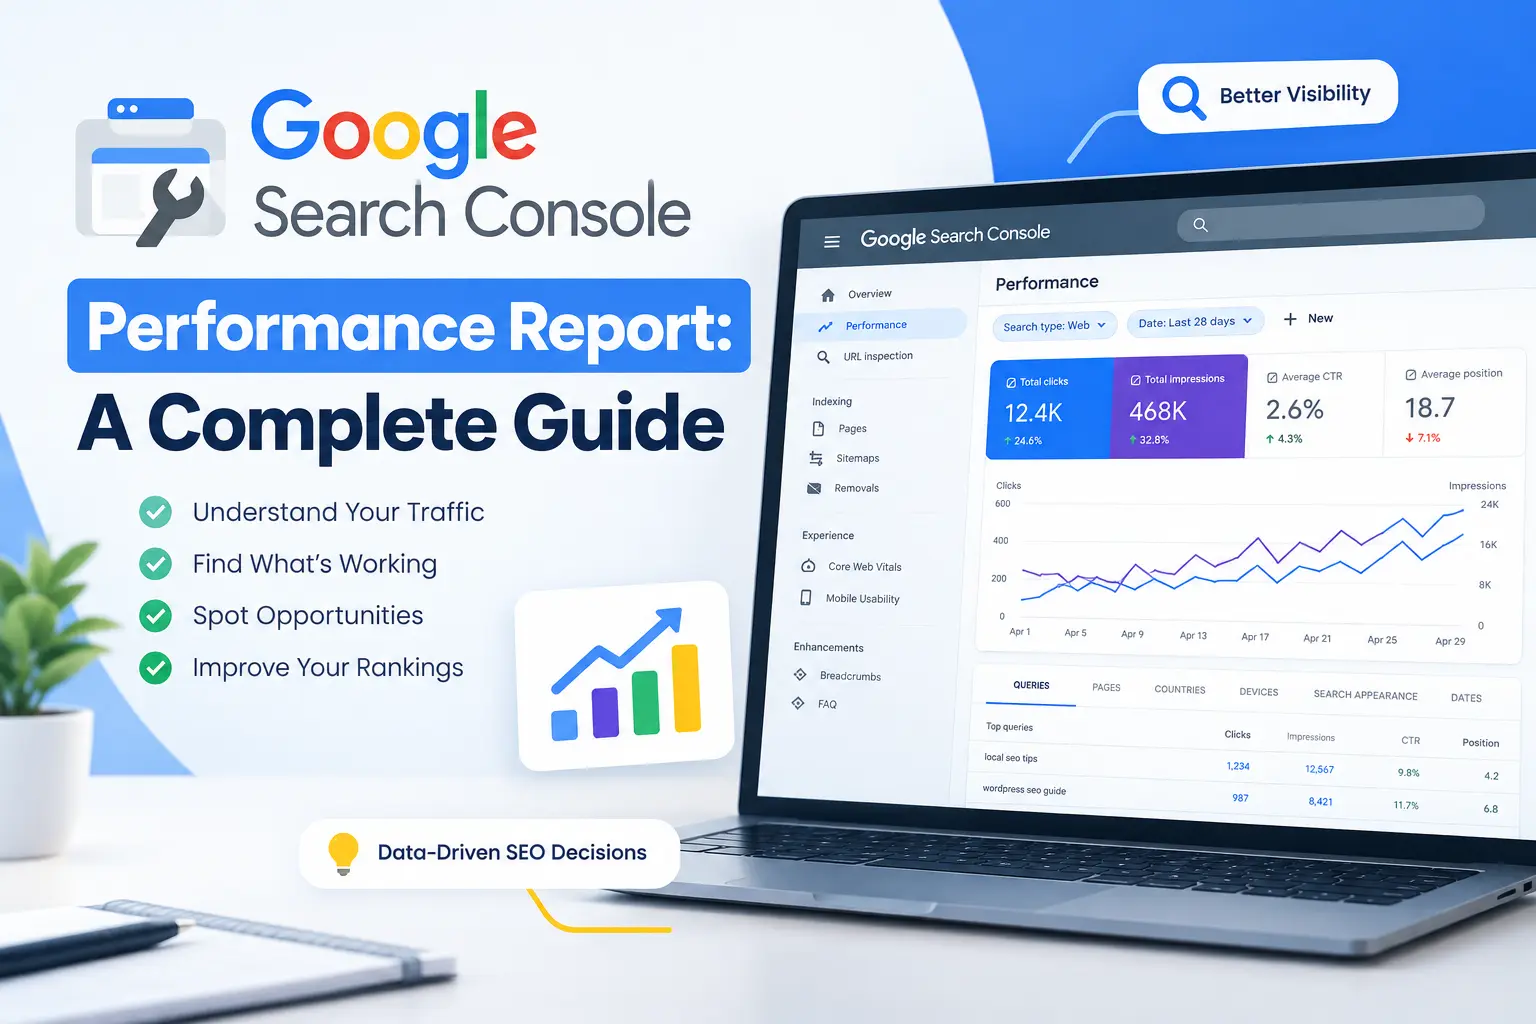
If you run a website and want to know exactly how it performs on Google, the Google Search Console performance report is the single most important tool you have. It is free, it comes straight from Google, and it tells you precisely which queries, pages, countries, and devices are bringing people to your site. Yet most website owners open this report, glance at a graph, and close the tab without ever understanding what they are actually looking at.
This guide breaks down the Google Search Console performance report in plain language, from start to finish. You will learn what every metric means, how to access and filter the data, how to compare time periods, how to export your findings, and — most importantly — how to turn raw numbers into decisions that grow your organic traffic. Whether you are a blogger, an agency owner, an in-house marketer, or a small business managing your own site, mastering the Google Search Console performance report is one of the highest-leverage SEO skills you can build, and it costs nothing but time.
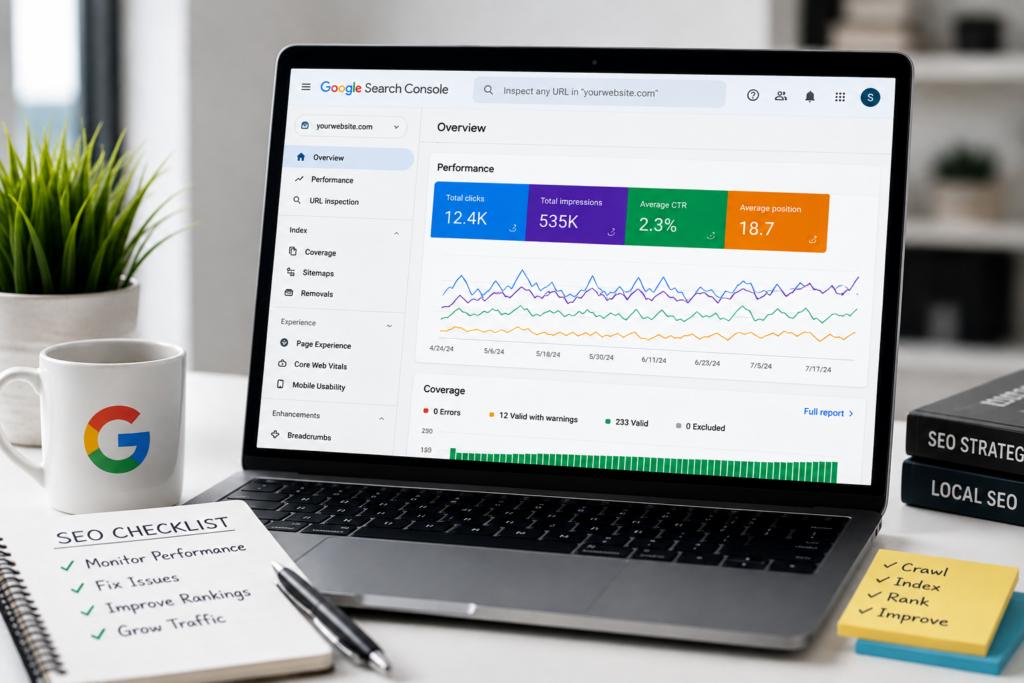
By the end of this article, you should be able to open the Google Search Console performance report for any site, understand exactly what the numbers mean, spot problems before they hurt your traffic, and identify concrete opportunities you can act on the same day. Think of this guide as a reference you can return to any time you sit down with the Google Search Console performance report and need a refresher on what a particular filter, metric, or trend actually means.
What Is the Google Search Console Performance Report?
The Google Search Console performance report is a built-in analytics dashboard inside Google Search Console (GSC) that shows how your website appears and behaves in Google Search results. Unlike Google Analytics, which tracks what happens after someone lands on your site, the Google Search Console performance report shows what happens before the click — how often your pages show up in search, how often people click on them, and where they typically rank.
At its core, the Google Search Console performance report answers four fundamental questions:
- How many times did my site appear in Google Search? (Impressions)
- How many times did people click through to my site? (Clicks)
- What percentage of people who saw my listing actually clicked it? (CTR)
- Where does my site typically rank for a given query? (Average Position)
Every website owner who has verified their property with Google Search Console has free access to this data, and if you have not yet connected your site, that should be step one before doing anything else in SEO. For a broader introduction to setting up the tool from scratch, our Google Search Console guide walks through verification and initial configuration in detail, including how to submit a sitemap so Google can begin crawling and reporting on your pages.
Why the Google Search Console Performance Report Matters
Many beginners rely purely on rankings shown in third-party rank trackers, but data from search consoles is more accurate because it comes directly from Google’s own search logs rather than an estimate produced by an external crawler simulating searches from a handful of locations.
Here is why this report deserves a permanent place in your weekly SEO routine:
- It reveals hidden keyword opportunities. Queries that generate impressions but few clicks often point to quick wins — pages ranking on page two that just need a small push to reach page one.
- It shows content decay early. A drop in clicks or impressions for a page is often the first visible sign that a competitor has overtaken you, that seasonal demand has shifted, or that content needs refreshing.
- It validates your SEO strategy. If your SEO strategy is working, this dashboard will show climbing impressions and clicks over successive months.
- It’s free and largely unsampled. Unlike many paid SEO tools that estimate traffic from third-party panels, the Google Search Console performance report gives you real numbers straight from Google, going back up to sixteen months.
Because this data is so reliable, it should be the foundation of any technical or content-based SEO audit, including the process outlined in our SEO audit checklist, which relies heavily on cross-referencing performance report trends against on-site technical health.
How to Access the Google Search Console Performance Report
Getting to this dashboard takes only a few clicks:
- Log in to Google Search Console.
- Select the property (website) you want to analyze.
- In the left-hand sidebar, click Performance.
- By default, you’ll land on the Search results view, which is the main Google Search Console performance report.
Once inside, you’ll see a large graph at the top showing Total Clicks and Total Impressions over time, with a table of queries beneath it. This is the heart of the Google Search Console performance report, and everything else in the interface is built around filtering and slicing this same underlying dataset in different ways.
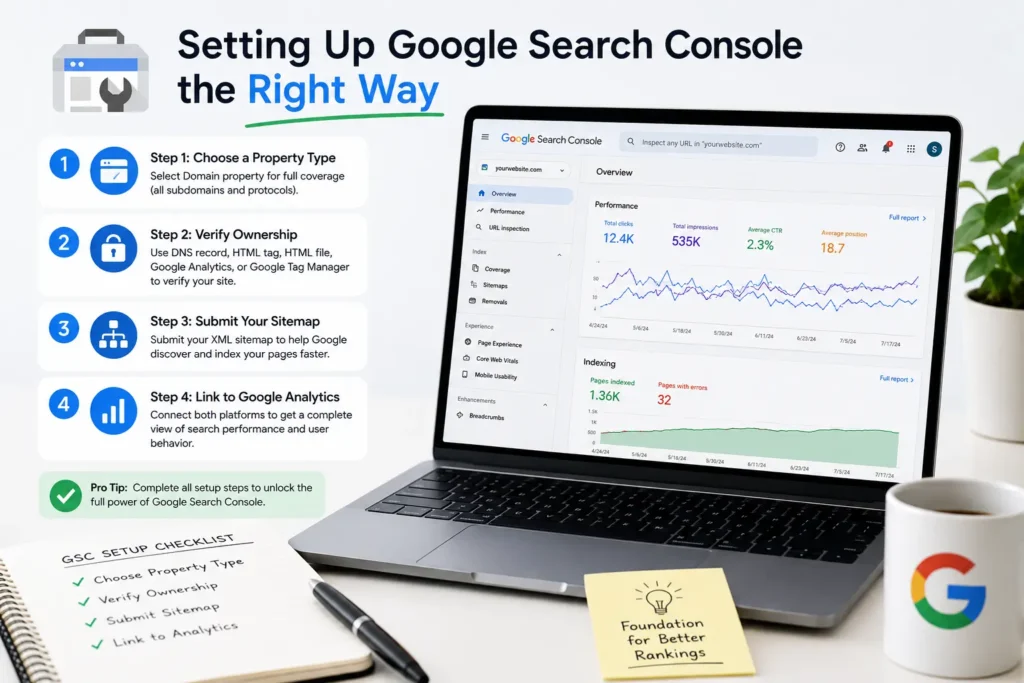
If your property was only recently verified, don’t be alarmed if the report looks empty for the first few days — Google needs time to accumulate enough search activity before the Google Search Console performance report begins populating meaningful numbers. It’s also worth bookmarking the report directly, since you’ll likely be checking your Google Search Console performance report far more often than any other section of the platform once you start building it into your regular workflow.
Understanding the Core Metrics
To read the Google Search Console performance report correctly, you need to understand its four primary metrics inside and out, because every decision you make from this data depends on interpreting them properly.
Clicks
Clicks represent the number of times a user clicked through from the Google Search results page to your website. This is the most tangible metric in the report because it reflects actual visits rather than potential visibility. A steady rise in clicks is usually the clearest sign that your SEO efforts are paying off, while a sudden drop deserves immediate investigation.
Impressions
An impression is counted every time your page appears in search results, even if the user doesn’t scroll far enough to see it or doesn’t click at all. Impressions tell you how visible your content is, regardless of whether that visibility ultimately converts into traffic. A page can gain impressions for months before it starts earning meaningful clicks, which is why patience matters when interpreting the Google Search Console performance report.
Click-Through Rate (CTR)
CTR is calculated as clicks divided by impressions, expressed as a percentage. A low CTR relative to your position is one of the most actionable insights this report can offer, because it usually points to a weak title tag or meta description rather than a fundamental ranking problem.
Average Position
Average position is the average ranking of your page across all the queries and instances it appeared for during the selected date range. It’s an average, so a page can show an average position of eight while ranking first for one query and twentieth for another. Understanding this nuance is essential to correctly interpreting the Google Search Console performance report and avoiding false conclusions about where you “really” rank.
The Filters and Dimensions Inside the Report
One of the most powerful features of the Google Search Console performance report is its filtering system. Below the main graph, you can switch between five tabs (dimensions), each of which reorganizes the same underlying data:
- Queries — the exact search terms people used to find your site.
- Pages — which URLs on your site received clicks and impressions.
- Countries — a geographic breakdown of your search traffic.
- Devices — desktop, mobile, and tablet performance.
- Search Appearance — whether your listing showed as a rich result, FAQ snippet, video result, and so on.
You can also filter by:
- Search type: Web, Image, Video, or News
- Date: custom ranges, up to sixteen months of history
- Custom search terms: include, exclude, or exact-match specific queries
Combining these filters lets you ask very specific questions of the data, such as “which mobile queries from the United States have high impressions but low CTR?” — a question that would be nearly impossible to answer without this level of segmentation built into the Google Search Console performance report.
Step-by-Step: How to Analyze the Google Search Console Performance Report
Reading this dashboard effectively is a process, not a one-time glance. Here’s a repeatable workflow you can reuse every time you sit down with your data.
Step 1: Set the Right Date Range
Always compare like periods. A common approach is to compare the last twenty-eight days to the previous twenty-eight days, or year-over-year for seasonal businesses. The Google Search Console performance report lets you overlay two date ranges directly on the graph, making trends immediately visible rather than something you have to calculate manually.
Step 2: Look at the Big Picture First
Before diving into individual queries, check the overall trend lines for clicks and impressions. Is the site growing, flat, or declining? This macro view tells you whether you’re dealing with a site-wide issue — such as a Google algorithm update or a broad technical problem — or an isolated issue affecting only a handful of pages.
Step 3: Sort Queries by Impressions
Sort the query table by impressions, from highest to lowest. Queries with high impressions but low CTR and a position between five and fifteen are your best optimization targets — they’re already being shown to a lot of people; they just need a nudge to earn more clicks.
Step 4: Cross-Reference With the Pages Tab
Switch to the Pages tab of the Google Search Console performance report to see which URLs are driving, or losing, the most traffic. If a previously strong page has dropped in impressions, that page may need a content refresh, updated internal links, or a technical fix — topics covered in our guide to indexing issues in Search Console.
Step 5: Check Device and Country Splits
Sometimes a decline shows up only on mobile or only in a specific country. Filtering by device often uncovers issues related to Core Web Vitals or mobile usability that wouldn’t be obvious from the aggregate numbers alone.
Step 6: Identify Quick Wins
Look for queries ranking between positions eight and twenty. These are pages that Google already considers relevant enough to show on or near page one — often just a title tag rewrite, a few added internal links, or an expanded content section away from a meaningful ranking boost.
A Practical Example
Imagine a local services website notices, while reviewing its Google Search Console performance report, that a blog post about “seasonal maintenance tips” has 4,200 impressions over the last month but only 38 clicks — a CTR under 1%, well below what its average position of six would normally produce. Digging into the Queries tab reveals the page ranks well for a broad term but the existing title tag doesn’t mention the season or year, making it look outdated compared to competing results.
After rewriting the title and meta description to include the current year and a clearer benefit statement, the site owner checks the Google Search Console performance report again three weeks later. Impressions have stayed roughly the same, but clicks have nearly tripled, and CTR has climbed to just over 3%. This is exactly the kind of pattern the report is built to surface — not by generating new visibility, but by helping you convert visibility you already have into actual visits.
Common Mistakes When Reading the Report
Even experienced marketers misinterpret the Google Search Console performance report. Watch out for these common pitfalls:
- Confusing average position with actual rankings. A page can average position six while never actually ranking at position six for any single query — it’s a blended average across dozens or hundreds of queries.
- Ignoring impressions. Many people only track clicks, missing early warning signs of visibility changes that haven’t yet affected traffic.
- Not filtering out branded queries. If your brand name generates a large share of clicks, it can mask how your non-branded, top-of-funnel content is actually performing.
- Comparing mismatched date ranges. Comparing a seven-day period to a thirty-day period will always produce misleading percentage changes.
- Forgetting about data omission for low-volume queries. Google sometimes leaves very low-volume or privacy-sensitive queries out of the visible table entirely, so the totals won’t perfectly match the sum of visible rows.
Using the Data to Improve SEO
The real value of the Google Search Console performance report isn’t in reading it — it’s in acting on it. Here are practical ways to turn the data into measurable results.
Improve Titles and Meta Descriptions
If the report shows high impressions but low CTR for a page, rewrite the title tag and meta description to be more compelling and better match search intent. This is one of the fastest wins available in on-page SEO, and it pairs well with the fundamentals covered in our on-page SEO guide.
Find New Keyword Opportunities
The Queries tab frequently surfaces keyword variations you never explicitly targeted. If you notice recurring long-tail queries with decent impressions, consider building dedicated content around them — a process that complements traditional keyword research for low-competition terms.
Prioritize Content Updates
Pages with declining clicks and impressions, as shown in the Google Search Console performance report, are prime candidates for a content refresh: updated statistics, expanded sections, better formatting, and fresh internal links pointing to related resources.
Strengthen Internal Linking
If a page is ranking well for a valuable query but isn’t converting into clicks, sending more internal links to it from related articles can increase both its authority and its visibility for that query over time.
Monitor After Algorithm Updates
Whenever Google rolls out a core update, the Google Search Console performance report is the fastest way to see whether your site was positively or negatively affected, well before third-party tools catch up with their own delayed analysis.
Comparing Date Ranges in the Report
The comparison feature is one of the most underused parts of the Google Search Console performance report. To use it:
- Click the date filter at the top of the report.
- Select “Compare.”
- Choose two custom or preset ranges (for example, the last three months versus the previous three months).
- Google Search Console overlays both periods on the same graph and table for direct comparison.
This comparison view is especially useful for measuring the impact of a redesign, a migration, or a specific content campaign. If you recently completed a technical fix from a broader technical SEO audit, this is exactly where you’d go to verify whether the results actually moved the needle.
Exporting the Google Search Console Performance Report
For deeper analysis, reporting to clients, or long-term tracking, you can export this data in three ways:
- Google Sheets — creates a live-updating spreadsheet linked directly to your GSC data.
- CSV — a static download, ideal for one-time analysis in Excel or another spreadsheet tool.
- API — for developers who want to pull the underlying data programmatically and build custom dashboards or automated alerts.
Exporting the Google Search Console performance report regularly, at least once a month, also protects you from data loss, since Google Search Console only retains up to sixteen months of history at any given time.
Google Search Console Performance Report vs. Google Analytics
A common point of confusion is how this dashboard differs from Google Analytics. They measure entirely different stages of the user journey:
| Metric | Google Search Console Performance Report | Google Analytics |
|---|---|---|
| Data source | Google Search results | Website visits |
| Shows impressions | Yes | No |
| Shows keywords | Yes (mostly unfiltered) | Limited or encrypted |
| Shows on-site behavior | No | Yes (bounce rate, time on page) |
| Best for | Search visibility and CTR | Post-click user behavior |
Using both tools together gives you a complete picture: the Google Search Console performance report tells you how people find you, while Google Analytics tells you what they do once they arrive on your pages. Neither tool fully replaces the other, and any team that relies on only one is missing half the story their traffic data is trying to tell them.
Tools That Pair Well With the Performance Report
While the built-in dashboard is powerful on its own, a few complementary practices help you get even more out of it. Regularly running a local SEO audit alongside your performance report review helps you catch technical issues that might be capping your visibility. Reviewing the Search Console coverage report alongside performance data is also useful, since indexing problems and traffic drops often show up together. If you’re new to the platform altogether, this walkthrough on how to use Google Search Console covers the basics of navigating every report, not just performance.
Best Practices for Working With the Report
To get consistent value out of your data over time, build these habits into your routine:
- Review the report weekly, not just when traffic drops unexpectedly.
- Always segment by branded versus non-branded queries before drawing conclusions.
- Cross-check any sudden drop against known Google algorithm updates to rule out a broader industry-wide shift rather than a site-specific problem.
- Export data monthly so you retain history beyond Google’s sixteen-month limit.
- Combine your review of the Google Search Console performance report with a full SEO audit at least twice a year.
- Don’t chase every small fluctuation — look for sustained trends across at least two to four weeks before making major changes based on short-term noise.
Frequently Asked Questions
How often does the Google Search Console performance report update? Data typically has a two- to three-day delay, so the most recent few days you see may still be incomplete or subject to revision.
Why do my total clicks not match the sum of all queries? The report omits certain very low-volume or privacy-protected queries from the visible table, even though they’re still counted in the aggregate totals shown above the graph.
Can I see performance data for more than sixteen months? No, the dashboard only stores up to sixteen months of historical data, which is exactly why regular exports of the Google Search Console performance report are recommended for anyone tracking long-term trends.
Is average position the same as my actual Google ranking? Not exactly. Average position is a blended average across every query and impression during the selected period, not a single fixed rank for one search term.
Does the report include AI Overviews or featured snippets? Google has been gradually expanding what search appearance types are tracked, so it’s worth checking the Search Appearance tab of your Google Search Console performance report periodically for updates as new formats roll out.
Final Thoughts
The Google Search Console performance report is, without exaggeration, one of the most valuable free resources available to anyone doing SEO. It tells you exactly how Google sees your site, which queries matter most, and where the biggest opportunities are hiding in plain sight. Learning to read it properly isn’t optional if you’re serious about organic growth — it’s the foundation everything else in your strategy is built on.
Make it a habit to open your Google Search Console performance report every week, look beyond the surface-level graph, and dig into queries, pages, and devices individually. Over time, this single habit will teach you more about your audience and your content’s real-world performance than almost any other SEO tool available, paid or free.
If you haven’t already set up your property, start with our complete Google Search Console setup guide, and once you’re comfortable reading the report, pair it with a full local SEO audit to make sure your technical foundation supports everything the data is telling you.
