
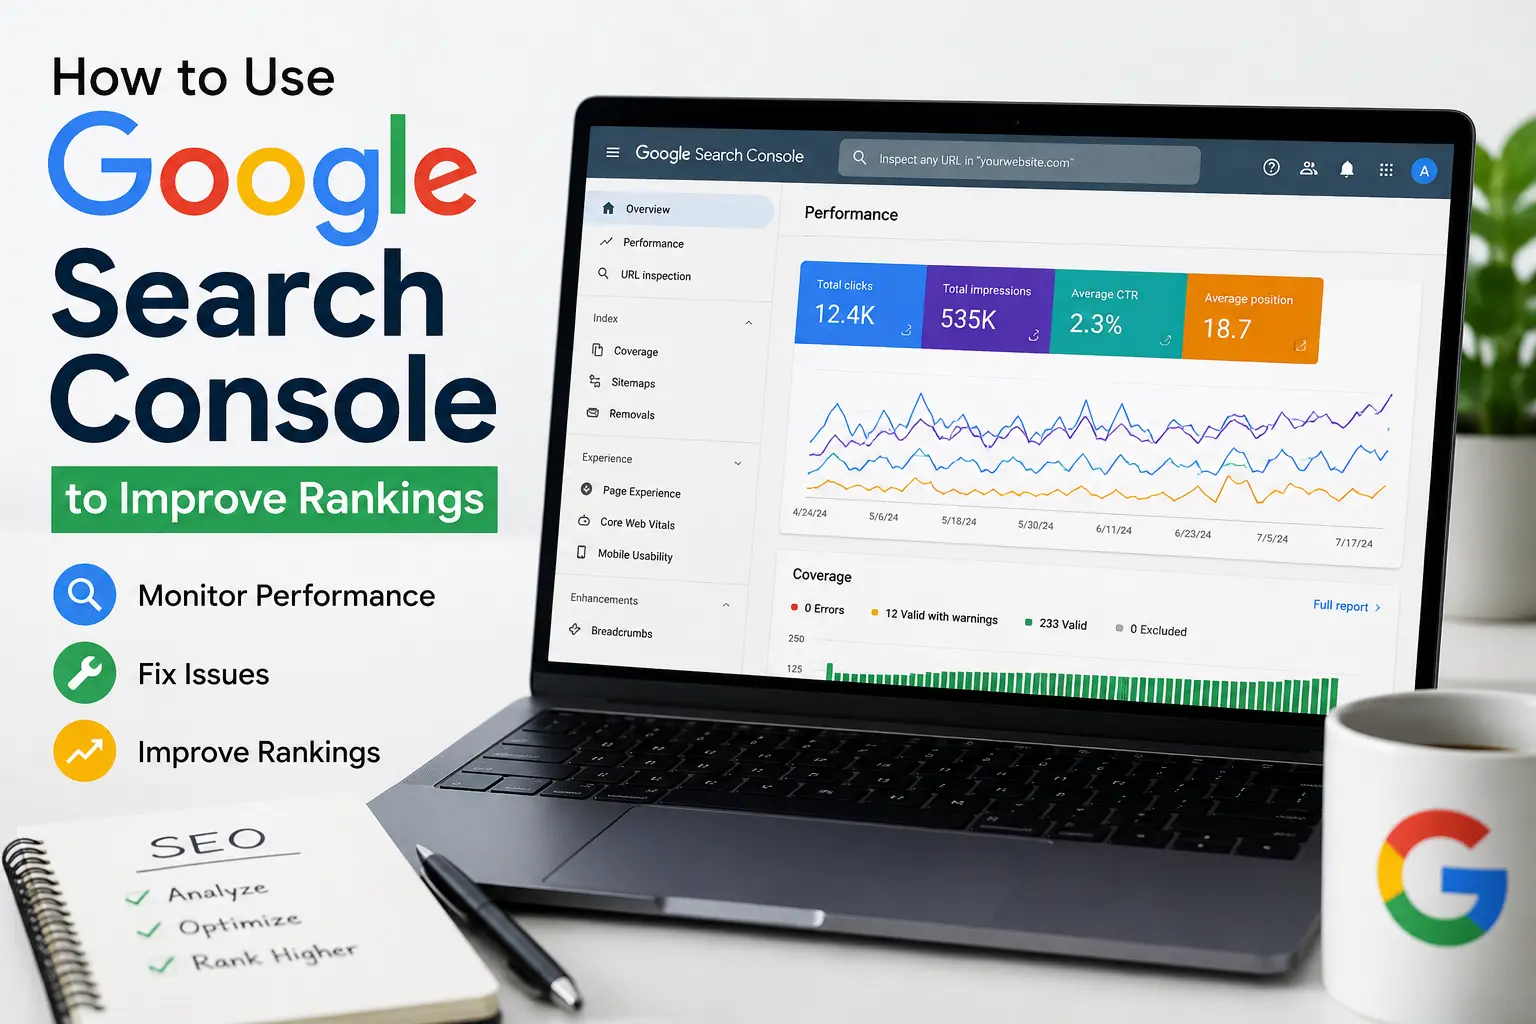
Google Search Console is the single most underused tool in most local business owners’ SEO toolkit. It’s free, it comes directly from Google, and it tells you exactly how your website is performing in search — yet most businesses either never set it up or check it once and never return. That’s a mistake, because the data inside Google Search Console is often the fastest way to diagnose why your rankings have stalled and what to fix first.
This guide walks through everything you need to know: what Google Search Console is, how to set it up correctly, how to read every major report, and exactly how to use that data to climb higher in local search results. Whether you’re a home services business, a towing company, or an agency managing multiple client sites, this guide gives you a complete, practical framework for putting Google Search Console to work.
What Is Google Search Console?
Google Search Console is a free platform from Google that lets website owners monitor, maintain, and troubleshoot how their site appears in Google’s search results. It shows you which queries bring people to your site, which pages Google has indexed, how your pages perform on mobile devices, whether Google has found any errors crawling your site, and much more.
Unlike Google Analytics, which focuses on what happens after a visitor lands on your website, Google Search Console focuses on what happens before that — how Google discovers, crawls, indexes, and ranks your pages. Think of it as a direct line of communication between your website and Google’s search engine.
It’s also worth understanding what this platform is not. It’s not a ranking tool that boosts your position simply by being installed, it’s not a substitute for actually improving your content or technical setup, and it’s not something you can configure once and ignore. Every report inside the platform is a reflection of decisions Google has already made about your site — how it crawls you, what it indexes, and how it ranks your pages for specific queries. The value comes entirely from how consistently you act on what those reports reveal.
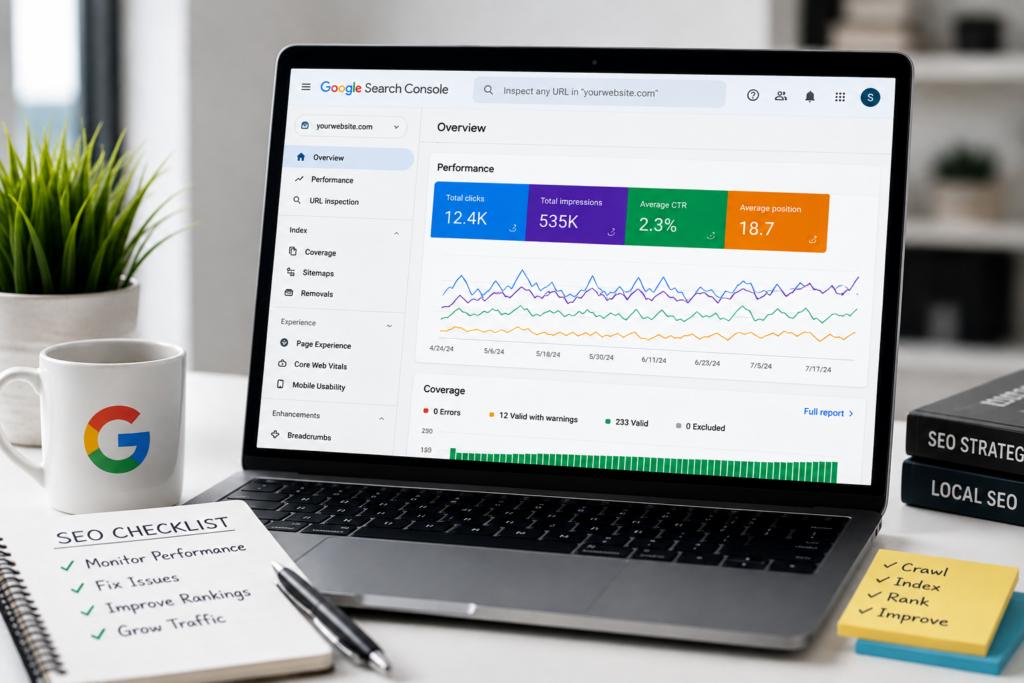
Google offers this service completely free to any site owner, which makes it one of the highest-value tools available to a small business with a limited marketing budget. While paid third-party SEO platforms often package similar data behind a subscription, the core reporting inside this free Google product remains the most accurate source available, since it comes directly from the search engine itself rather than an estimate or a third-party crawler.
If you’re building out a full local SEO strategy, Google Search Console works best alongside other foundational pieces like a properly optimized Google Business Profile and a solid local SEO guide for small businesses, since search visibility depends on multiple systems working together rather than any single tool in isolation.
Why Google Search Console Matters for Local Businesses
Local businesses often assume tools like this are only for large enterprise sites, but that couldn’t be further from the truth. Here’s why every local business should be using Google Search Console:
- Free, direct data from Google. No other tool tells you exactly which search queries triggered your listing, how often, and where you ranked, straight from the source.
- Early problem detection. Google Search Console flags indexing errors, security issues, and mobile usability problems before they quietly tank your rankings.
- Keyword discovery. The Performance report surfaces real queries people are already using to find you, often revealing opportunities you never targeted intentionally.
- Technical health monitoring. From broken links to slow-loading pages, Google Search Console gives you visibility into technical issues that hurt both rankings and user experience.
- A feedback loop for content decisions. Instead of guessing which blog posts or service pages are working, this platform shows you exactly what’s driving clicks and impressions.
If your business isn’t appearing in search the way it should, checking your Search Console data is one of the first diagnostic steps worth taking, alongside reviewing why businesses sometimes don’t show up on Google at all.
Setting Up Google Search Console the Right Way
Before you can use any of the reports inside Google Search Console, you need to verify ownership of your website. Here’s how to do it correctly.
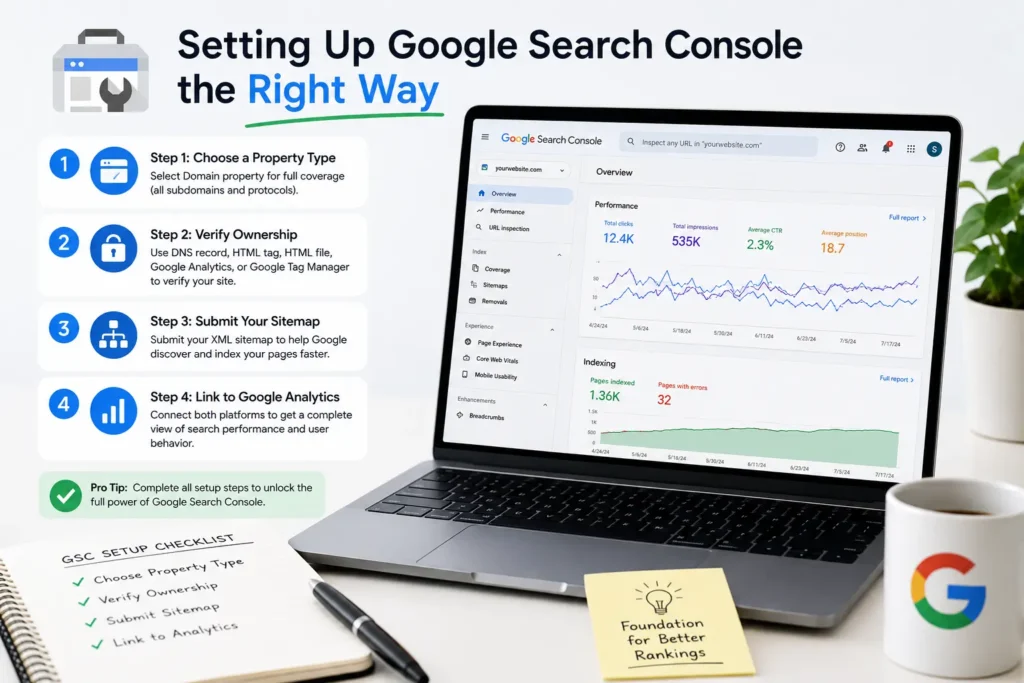
Step 1: Choose a Property Type
Google Search Console offers two property types: a Domain property, which covers all subdomains and protocols (http, https, www, non-www) under one roof, and a URL-prefix property, which covers only the exact URL you enter. For most local businesses, the domain property is the better choice since it consolidates all your data in one place rather than splitting it across multiple versions of your site.
Step 2: Verify Ownership
Google offers several verification methods: DNS record (required for domain properties), HTML file upload, HTML tag, Google Analytics, or Google Tag Manager. If your site runs on WordPress, verifying through an existing Google Analytics or Tag Manager connection is usually the fastest route, but a DNS TXT record added through your domain registrar works reliably for every setup.
Step 3: Submit Your Sitemap
Once verified, submit your XML sitemap through the Sitemaps section of Google Search Console. This tells Google exactly which URLs exist on your site and speeds up the discovery and indexing process significantly compared to relying purely on organic crawling.
Step 4: Link to Google Analytics
If you use Google Analytics, linking the two platforms together gives you a more complete picture, combining Search Console’s pre-click search data with Analytics’ post-click behavior data for a fuller view of the customer journey.
Skipping any of these setup steps limits how useful Google Search Console can be, so treat this as the non-negotiable foundation before diving into the reports themselves.
The Complete Google Search Console Reports Walkthrough
Below is a section-by-section breakdown of every major report inside Google Search Console and exactly what to do with the data each one provides.
1. The Performance Report
This is the report most business owners open first, and for good reason. It shows four core metrics — clicks, impressions, average CTR (click-through rate), and average position — broken down by query, page, country, device, and date range.
Use this report to identify which keywords are already driving traffic, which pages get the most impressions but few clicks (a sign your title tag or meta description needs work), and which queries sit just outside the first page, ready to be pushed higher with a bit of extra optimization. This report alone justifies setting up Google Search Console even if you never touch another feature.
2. The URL Inspection Tool
This tool lets you check the exact indexing status of any individual page — whether Google has crawled it, when it was last crawled, whether it’s indexed, and whether there are any issues preventing it from appearing in search. After publishing a new page, running it through the URL Inspection tool and requesting indexing can speed up how quickly Google discovers and ranks it.
3. The Pages (Indexing) Report
This report shows which pages on your site are indexed and, more importantly, which ones aren’t — along with the specific reason why. Common exclusion reasons include duplicate content, noindex tags, crawl errors, or pages Google has deemed not worth indexing. Reviewing this report regularly is one of the fastest ways to catch technical problems before they quietly cost you traffic.
4. The Sitemaps Report
This section confirms whether your submitted sitemap was processed successfully and how many URLs were discovered from it. If you notice a mismatch between the number of pages on your site and the number Google has discovered, it’s worth investigating whether your sitemap is generating correctly, which is especially common on WordPress sites using SEO plugins like Rank Math or Yoast.
5. The Mobile Usability Report
Since most local searches happen on mobile devices, this report is critical. It flags issues like text that’s too small to read, clickable elements placed too close together, or content wider than the screen. Fixing every issue flagged here directly supports both user experience and mobile search rankings.
6. The Core Web Vitals (Experience) Report
This report evaluates your site’s loading performance, interactivity, and visual stability using Google’s Core Web Vitals metrics. Poor scores here can hold back your rankings even if your content is excellent. For a deeper technical breakdown of these metrics, our guide on website speed and Core Web Vitals covers exactly how to diagnose and fix common speed issues that show up in this report.
7. The Links Report
This report shows both internal links (pages within your own site linking to each other) and external links (other websites linking to you). Reviewing your top linking pages and top linked pages helps you understand which content is earning backlinks naturally and whether your internal linking structure is distributing authority effectively across your site.
8. The Security and Manual Actions Reports
These reports alert you if Google has detected malware, hacked content, or a manual penalty against your site. A manual action can devastate your rankings overnight, so checking this section periodically — especially after any unexpected ranking drop — should be part of your routine.
9. The Enhancements Reports
Depending on your site’s structured data, Google Search Console may show reports for breadcrumbs, FAQ markup, review snippets, or other schema types. These reports confirm whether your structured data is implemented correctly and eligible for rich results in search.
10. The Removals Tool
This tool lets you temporarily hide a URL from Google’s search results, which is useful for outdated pages, accidental publishes, or content you need to remove quickly while a permanent fix is in progress.
How to Use Google Search Console to Improve Rankings: A Step-by-Step Strategy
Understanding the reports is only half the battle. Here’s how to actually turn Google Search Console data into ranking improvements.
Find and Target “Striking Distance” Keywords
Open the Performance report, filter by average position between 8 and 20, and sort by impressions. These are keywords where you’re already showing up but not quite breaking into the top results. Because Google already considers your page relevant enough to show for these queries, a focused round of on-page optimization — better headers, more thorough content, added internal links — can push them into the top three or five positions relatively quickly. This tactic alone makes Google Search Console worth checking weekly.
Fix Low Click-Through-Rate Pages
Sort the Performance report by impressions, then look for pages with high impressions but low CTR relative to their ranking position. This usually signals a weak title tag or meta description that isn’t compelling searchers to click, even though your page is being shown. Rewriting these elements with clearer benefits, numbers, or local keywords is one of the fastest, lowest-effort wins available inside Google Search Console.
Resolve Indexing Issues Immediately
Any page that should be indexed but isn’t represents lost potential traffic. Check the Pages report weekly for new exclusions, and use the URL Inspection tool to diagnose and fix each one. A single important service page stuck in “Discovered — currently not indexed” status can represent a meaningful amount of missed traffic, so this should always be a priority task inside Google Search Console.
Monitor Performance After Content Updates
Whenever you significantly update a page — refreshing an old blog post, rewriting a service page, adding new sections — track its performance in the weeks that follow. Google Search Console makes it easy to compare a date range before and after the change, giving you clear evidence of whether the update actually helped.
Track Rankings After Algorithm Updates
Whenever Google rolls out a core algorithm update, checking the Performance report for sudden drops or gains in specific queries helps you understand how the update affected your site specifically, rather than relying purely on general industry commentary.
Use the Query Data to Guide New Content
The queries showing up in your Performance report — especially ones with decent impressions but no dedicated page — are essentially free keyword research handed to you by Google itself. Cross-reference this with a broader keyword research process for local businesses to build out new content that directly targets demand you’re already seeing.
Audit and Strengthen Internal Linking
Use the Links report to see which pages have the fewest internal links pointing to them. Important pages — like your core service pages — should never be internal-linking orphans. Strengthening internal links to underlinked but important pages is a quick, low-risk way to pass more authority to where it matters most.
Understanding Crawl Stats and Crawl Budget
Deep inside the Settings menu, the Crawl Stats report shows exactly how Googlebot is interacting with your site — total crawl requests, average response time, and a breakdown of crawl purpose and file type. Most small local business sites never need to worry about crawl budget, since Google can typically crawl a few hundred pages without any issue. But as your site grows — more service-area pages, more blog content, more location pages for a multi-location business — this report becomes more relevant.
If you notice crawl requests dropping sharply while your site is actively adding new pages, or if average response time is climbing, that’s often a sign of a server performance issue rather than anything specific to search itself. Slow response times waste crawl budget on fewer pages per visit, which can delay how quickly new or updated content gets indexed. Keeping an eye on this data, especially after a hosting change or a site migration, helps catch problems that might otherwise go unnoticed until rankings start slipping.
How This Tool Handles JavaScript and Rendering Issues
Many modern websites, especially those built with frameworks like React or heavily reliant on client-side JavaScript, can run into rendering problems that aren’t obvious just from looking at the page in a browser. Google has to render JavaScript-heavy pages in a separate step before it can fully understand the content, and this process can sometimes fail or produce an incomplete view of the page.
The URL Inspection tool includes a “View Crawled Page” feature that shows exactly what Googlebot saw after rendering, including a screenshot and the rendered HTML. If content that’s visible to a human visitor doesn’t appear in this rendered view, it likely won’t be indexed or ranked properly, even though everything looks fine on the front end. For most WordPress-based local business sites this is rarely an issue, but any site using a custom-built frontend or heavy JavaScript frameworks should check this feature regularly to confirm nothing important is being missed during rendering.
Common Data Quirks and Limitations to Keep in Mind
A few quirks catch many site owners off guard when they first start relying on this data:
- Data delay. Performance data typically lags by one to three days, so the most recent date range shown is rarely complete.
- Sampling and rounding. For very low-traffic queries, some numbers are rounded or grouped, which can make small discrepancies appear between different filtered views of the same underlying data.
- Anonymized queries. A portion of search queries, especially rare or personally identifiable ones, are filtered out entirely and won’t appear in the report, even though they generated real clicks or impressions.
- 16-month data limit. The Performance report only stores roughly sixteen months of historical data, so long-term year-over-year comparisons require exporting and archiving data periodically if you want to look back further.
- Property-specific data. If you switch from a URL-prefix property to a domain property (or vice versa), historical data doesn’t automatically carry over, which is another reason the domain property is usually the better long-term choice from the start.
Understanding these quirks prevents misreading the data and jumping to the wrong conclusions about what’s actually happening with your site’s visibility.
Google Search Console for Different Business Types
While the fundamentals apply to every website, certain industries get particular value from specific reports.
HVAC and Home Services
Seasonal service businesses like HVAC companies see sharp swings in search demand throughout the year. Watching the Performance report closely during seasonal transitions helps you catch demand shifts early and adjust content accordingly. Pair this with our guides on HVAC SEO strategy and HVAC website optimization for a complete approach.
Appliance Repair
Appliance repair businesses often serve many overlapping neighborhoods, making the query and page filters inside Google Search Console especially useful for identifying which specific service-area pages are underperforming. Our appliance repair SEO guide covers the broader strategy this data should feed into.
Multi-Location and Franchise Businesses
For businesses with several locations, filtering the Performance report by page or URL pattern helps isolate how each individual location page is performing, rather than looking only at aggregate site-wide numbers that can hide underperforming locations.
Agencies Managing Multiple Client Sites
Agencies benefit enormously from setting up Google Search Console for every client site from day one, since it becomes the single most reliable source of truth for reporting real ranking and indexing progress rather than relying solely on third-party rank trackers.
Common Google Search Console Mistakes to Avoid
Even experienced site owners make these mistakes when working with Google Search Console:
- Never setting it up at all. The single biggest mistake is simply not verifying your site, which means flying blind on indexing and search performance data entirely.
- Ignoring the Coverage/Pages report. Businesses often only check the Performance report and completely miss growing indexing problems until traffic has already dropped.
- Requesting indexing repeatedly for the same URL. Google has rate limits on manual indexing requests, and spamming this feature doesn’t speed anything up — it can actually flag your account for unusual activity.
- Overreacting to short-term fluctuations. Search data is naturally noisy day to day. Look at trends over weeks and months rather than panicking over a single day’s dip.
- Not linking Google Analytics. Missing this connection means losing valuable context about what happens after a visitor clicks through from search.
- Forgetting to check Security and Manual Actions. These reports are easy to overlook but catastrophic to ignore if an issue actually appears.
- Not acting on the data at all. Simply viewing reports without making changes defeats the entire purpose. Google Search Console is a diagnostic tool, not a passive dashboard.
Google Search Console vs. Google Analytics: What’s the Difference?
These two free tools are often confused, but they serve very different purposes. Google Search Console shows what happens before a click — impressions, rankings, and the exact queries triggering your pages in search results. Google Analytics shows what happens after a click — how long visitors stay, what pages they view, and whether they convert into leads or customers.
A complete SEO strategy uses both together. Search Console tells you whether you’re being found; Analytics tells you what happens once someone actually arrives. Relying on just one gives you an incomplete picture of your website’s real performance.
Tools and Integrations That Pair Well With Google Search Console
While Google Search Console is powerful on its own, a few integrations extend its usefulness even further:
- Google Analytics: For the post-click behavioral data Search Console doesn’t track.
- Google Sheets (via Looker Studio or API): For building custom, automated reports beyond the built-in interface’s export limits.
- Rank tracking tools: While Search Console shows average position, dedicated rank trackers give a cleaner day-by-day view for specific target keywords.
- SEO plugins (Rank Math, Yoast): These generate the sitemaps that feed directly into your Search Console setup and often surface some of the same indexing data inside your WordPress dashboard.
- Looker Studio: Google’s free reporting tool connects directly to Search Console data, making it easy to build shareable dashboards for clients or stakeholders.
A 90-Day Plan for Using Google Search Console to Grow Rankings
If you want a structured approach rather than an open-ended list of tips, here’s a 90-day plan for putting this tool to work:
Days 1–15: Setup and audit. Verify your property, submit your sitemap, link Google Analytics, and review every report once to establish a baseline. Note any indexing errors, mobile usability issues, or security flags that need immediate attention.
Days 16–30: Fix technical issues. Resolve every indexing exclusion that shouldn’t exist, fix mobile usability errors, and address any Core Web Vitals problems flagged in the Experience report. This phase focuses purely on removing obstacles between your content and search visibility.
Days 31–60: Optimize for striking-distance keywords. Pull your list of queries ranking between positions 8 and 20, and systematically improve the corresponding pages — stronger headers, more comprehensive content, better internal linking. This phase is where Google Search Console data starts translating directly into ranking gains.
Days 61–90: Content and CTR improvements. Rewrite title tags and meta descriptions for your highest-impression, lowest-CTR pages, and use query data to identify one or two new content pieces worth creating. By day 90, a disciplined routine built around Google Search Console data should show measurable improvement in both rankings and click-through rates.
After the initial 90 days, shift into a maintenance rhythm: check the Performance and Pages reports weekly, review Core Web Vitals and mobile usability monthly, and run a full audit of every report quarterly.
How Search Console Data Connects to the Rest of Your SEO Strategy
Google Search Console doesn’t operate in isolation — it works best as part of a broader system. The keyword opportunities it surfaces should feed your content calendar and connect back to the foundational keyword research process covered elsewhere on this site. The technical issues it flags, especially around page speed, tie directly into your Core Web Vitals and website speed work. And the indexing and ranking data it provides should be reviewed alongside your Google Business Profile performance, since organic website rankings and map pack visibility often move together.
It’s also worth understanding how search visibility ties into overall ranking factors more broadly. This overview of key local SEO ranking factors and this piece on how long SEO typically takes to show results both provide useful context for interpreting the trends you’ll see inside your own account over time.
Frequently Asked Questions About Google Search Console
Is Google Search Console free? Yes, completely free. There’s no paid tier or premium version — every report and feature is available to any verified website owner at no cost.
How long does it take for Google Search Console to show data? New properties typically start showing meaningful data within a few days to a couple of weeks, though a full 16-month historical view builds up gradually the longer your property stays verified.
Do I need coding knowledge to use Google Search Console? No. While the verification step and some advanced features benefit from technical familiarity, most day-to-day use — checking performance, reviewing indexing status, submitting sitemaps — requires no coding at all.
How often should I check Google Search Console? A quick weekly check of the Performance and Pages reports catches most issues early, with a deeper monthly review of Core Web Vitals, mobile usability, and links.
Can Google Search Console improve my rankings directly? Not by itself — it’s a diagnostic and monitoring tool, not a ranking factor. But the insights it provides, when acted on consistently, directly inform the changes that do improve your rankings.
What’s the difference between average position in Google Search Console and what I see when I search manually? Average position reflects an aggregate across all users, devices, and locations over the selected date range, while a manual search reflects just one snapshot for your specific location and device at that moment. They rarely match exactly, and that’s expected.
Should agencies set up Google Search Console for every client? Yes. It should be one of the very first things set up for any new client site, since it becomes the primary source of objective performance data for ongoing reporting and strategy decisions.
Can I use Google Search Console without a Google Analytics account? Yes, the two are independent tools and Google Search Console works perfectly well on its own. Linking Google Analytics simply adds extra context, but it’s not a requirement for using any of the core reports.
Why does my traffic in Google Search Console not match Google Analytics? The two tools measure different things using different methods, so exact matches are rare. Google Search Console counts clicks and impressions from search results specifically, while Google Analytics counts sessions and pageviews from all traffic sources, including direct visits, social media, and referrals. Some discrepancy is completely normal and expected.
What should I do if Google Search Console shows a manual action against my site? Read the specific reason provided in the report carefully, fix the underlying issue completely, and then submit a reconsideration request through the platform. Manual actions typically take time to review, so patience combined with a genuinely thorough fix produces the best outcome.
Is it worth checking Google Search Console daily? For most local businesses, a weekly check is sufficient. Daily checking rarely reveals meaningful new information given the natural data delay, and can lead to overreacting to normal day-to-day fluctuations rather than focusing on real trends.
Using the API for Bulk Reporting and Automation
For agencies or businesses managing several websites, manually checking the web interface for each property becomes time-consuming. Google offers a free API that lets you pull the same underlying data programmatically, which opens up several possibilities:
- Automated reporting dashboards built in Looker Studio, Google Sheets, or a custom application, pulling fresh performance data on a schedule rather than requiring a manual export each time.
- Bulk keyword tracking across hundreds of queries without hitting the interface’s row limits on exported data.
- Cross-property comparisons for agencies managing multiple client sites, aggregating data into a single unified view.
- Automated alerts that flag sudden drops in clicks or impressions before a human happens to notice the trend manually.
Setting this up requires some technical comfort — typically a Google Cloud project, API credentials, and either a script or a third-party connector tool — but for anyone managing several properties, the time saved compounds quickly. Even a simple weekly automated export into a spreadsheet can replace what would otherwise be a recurring manual task across every site in a portfolio.
Trends and Changes Worth Watching in 2026
Google continues to refine this platform’s reports and features regularly, and staying current helps you get more value from the data available.
Increased emphasis on Core Web Vitals and page experience. As Google continues weighing user experience signals more heavily in its ranking systems, the Experience report has become a more frequent stop for site owners rather than an occasional check, since experience issues increasingly show up as real ranking friction.
AI-driven search results changing click patterns. As AI-generated overviews appear more often at the top of search results, click-through rates for traditional organic listings have shifted in many niches. Watching your CTR trends closely over time helps you understand how these changes are affecting your specific pages, rather than relying on general industry commentary alone.
More granular indexing feedback. Google has steadily added more specific exclusion reasons and clearer guidance inside the Pages report over recent updates, making it easier to diagnose exactly why a page isn’t indexed rather than guessing from a vague generic status.
Expanded structured data reporting. As Google supports more types of rich results, the Enhancements section continues to grow, giving site owners more visibility into which schema types are eligible for extra visual real estate in search results.
Staying on top of these changes doesn’t require obsessively checking for updates, but a periodic look at what’s new in the platform’s help documentation ensures you’re not missing a feature that could save time or reveal a new opportunity.
A Practical Example: Diagnosing a Ranking Drop
To see how these reports work together in practice, imagine a local plumbing company notices their organic traffic has dropped noticeably over the past month. Here’s how a systematic walkthrough of Google Search Console would typically diagnose the issue.
Step one: Check the Performance report. Filtering by date range comparison shows exactly when the drop started and whether it affected specific queries, specific pages, or the site broadly. A sudden, site-wide drop points toward a technical or algorithmic cause, while a drop isolated to a handful of pages usually points toward a content or on-page issue specific to those pages.
Step two: Check the Pages report. If several previously indexed pages have moved into an excluded status, that’s often the smoking gun. Common causes include an accidental noindex tag pushed in a recent site update, a robots.txt change that unintentionally blocked crawling, or a server error that started returning incorrect status codes.
Step three: Use the URL Inspection tool on affected pages. Running a handful of the affected URLs through this tool confirms exactly what Google currently sees — whether the page is indexed, when it was last crawled, and whether the rendered content matches what a human visitor would see.
Step four: Check Security and Manual Actions. Ruling out a manual penalty or a security issue early saves time, since these more severe problems require a fundamentally different fix than a simple technical error.
Step five: Check Core Web Vitals and Mobile Usability. If nothing obvious shows up in indexing or manual actions, a recent regression in page speed or mobile experience — often caused by a plugin update, a new tracking script, or an image-heavy content update — can quietly suppress rankings without triggering any explicit warning elsewhere in the platform.
In this hypothetical scenario, the business might discover that a recent WordPress plugin update accidentally added a noindex tag to several service pages during a migration. Once identified through the Pages report and confirmed with the URL Inspection tool, the fix is straightforward — remove the incorrect tag, request re-indexing, and monitor the Performance report over the following weeks to confirm recovery.
This kind of methodical, report-by-report diagnosis is exactly why every local business benefits from being comfortable navigating this platform rather than treating a ranking drop as an unsolvable mystery. Nearly every ranking issue leaves a trace somewhere inside these reports, and knowing where to look turns a stressful guessing game into a straightforward troubleshooting process.
A Quick Glossary of Google Search Console Terms
A few terms show up constantly inside the platform and are worth defining clearly:
- Impressions: How many times a link to your page appeared in search results, regardless of whether it was clicked.
- Clicks: How many times someone actually clicked through to your site from a search result.
- CTR (click-through rate): Clicks divided by impressions, expressed as a percentage — a core metric for judging how compelling your listing looks in search results.
- Average position: The average ranking position across all the searches your page appeared for during the selected date range.
- Crawling: The process by which Googlebot visits and reads your pages.
- Indexing: The process by which Google stores and organizes a crawled page so it can be shown in search results.
- Coverage/Pages report: The section of Google Search Console showing which pages are indexed and which are excluded, along with the reason for each exclusion.
Getting comfortable with this vocabulary makes every other report inside Google Search Console far easier to interpret correctly, especially when discussing findings with a developer, an agency, or anyone else involved in managing your website.
Final Thoughts on Google Search Console
Google Search Console is one of the few genuinely free tools that gives you direct insight into how Google sees your website. From catching indexing problems before they cost you traffic to uncovering striking-distance keywords ready to be pushed onto page one, the data inside this platform consistently points toward the highest-leverage next steps for improving your rankings.
Treat Google Search Console as a weekly habit rather than a one-time setup task, pair its data with the broader SEO fundamentals covered throughout our site, and use every report as a prompt for action rather than a passive dashboard to glance at occasionally. Businesses that build this habit consistently outperform those that never open the platform after the initial setup.
If you’d like help setting up or interpreting your Google Search Console data, explore our industry-specific SEO guides or learn more about Trade Scale Hub. Getting comfortable with Google Search Console today is one of the simplest steps toward a stronger, more predictable stream of local search traffic tomorrow. And if you want hands-on support putting this data to work for your business, feel free to reach out to us — we’re happy to help.
